
A round up of my #bibliometrics. In time as my academic reputation development plan makes an impact it should be seen here. I’ve also created a data table to track change over time. I’ve badly neglected this aspect of my career so hopefully change and quite marked change should be possible.
Linear to exponential growth seems possible. There are ups and downs from year to year. Does reputation grow through a sigmoidal curve with a lag phase, a log growth phase, and then a saturation phase.
The other message I get is that an important outlet for my work are the reports prepared for the clients, such as defra, and many of these are now on websites as downloadable files. that is much better than as hardcopy gathering dust on shelves. Google Scholar picks up these outputs better than any other scholarly service.
Web of Science
| Total Articles inPublication List: | |
| Articles WithCitation Data: | |
| Sum of theTimes Cited: | |
| Average Citationsper Article: | |
| h-index: | |
| Last Updated: |
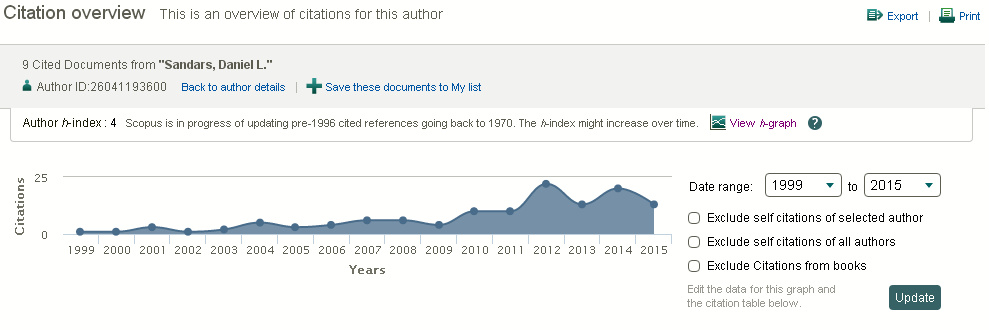
Scopus
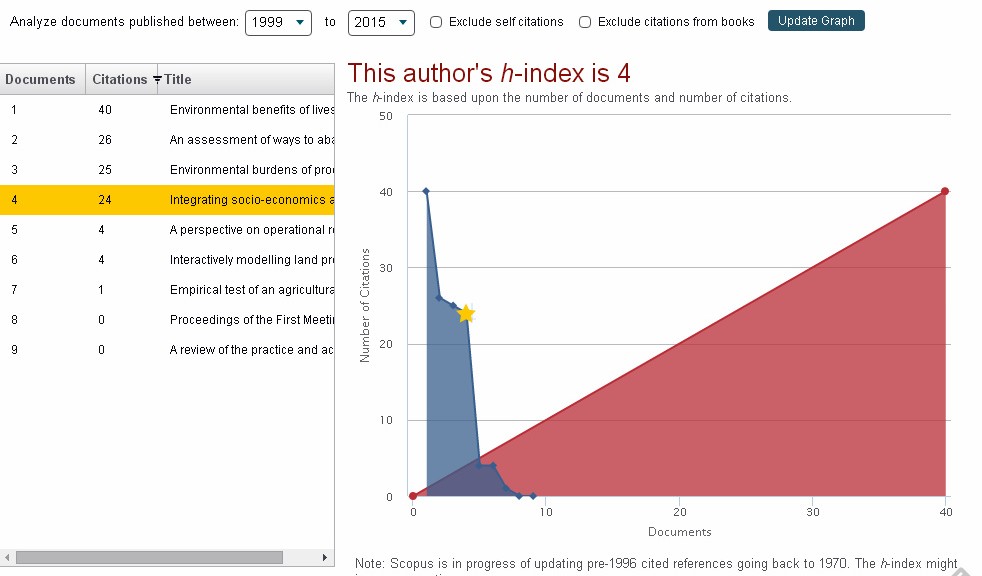
The h-index graph is fascinating as it shows that I could perhaps get to h index 5 or 6 quite soon but that I need more papers rather soon to get beyond that.

A scatter gun approach to the journal choices! These needs to become more directed in future.

Google Scholar
| Citation indices | All | Since 2010 |
|---|---|---|
| Citations | 822 | 651 |
| h-index | 10 | 9 |
| i10-index | 10 | 8 |

ResearchGate
Is there an opportunity to create more interaction and grow my RG score that way. Not a bad idea if i want to contribute to thought leadership in my field

Klout
I think what I am noticing is the impact of social media promotion of my academic work, particularly via twitter. It is always an open question whether social media outlets replicated for each aspect of your life. That means that your twitter followers get much more focussed and directed tweets rather than my random eclectic mix of interests?

